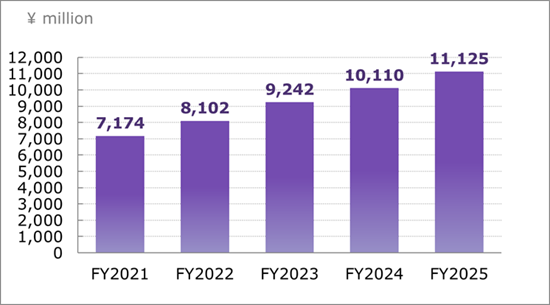
・In the engineer dispatching business, the number of engineers increased, and the utilization rate remained high due to an upward trend in demand for engineers. The trend of engineer shortages and wage increases by companies pushed up the unit price for newly graduated engineers at their first assignments. Strategic placements of current engineers in growth fields and high value-added fields to improve their work level also led to a rise in the unit price of engineers. In the contracting business, aggressive sales activities have led to an increasing number of engineers assigned to contracted projects. Furthermore, by shifting from engineer dispatching to contracting projects in response to client needs, the contracting business’s net sales ratio increased. As a result of all this, net sales for the fiscal year under review came to ¥12,046 million.
・In terms of profits, while there were recruitment investment, IT/DX investment, and training equipment investment as well as other expenses, these were absorbed by net sales growth, leading to an increase in all profits.
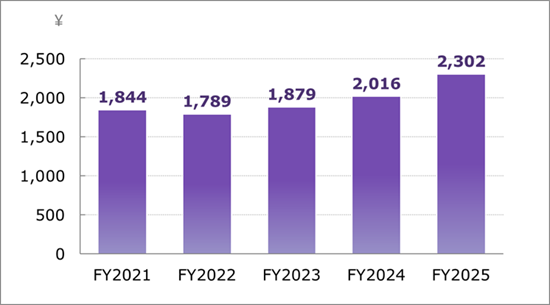
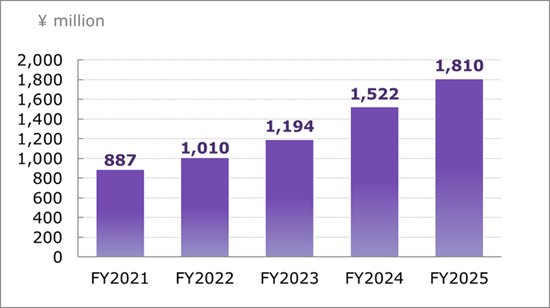
As a result of all this, operating profit came to ¥1,821 million, ordinary profit to ¥1,823 million, and profit attributable to owners of parent to ¥1,258 million.
◾️Number of engineers increased
◾️Utilization rate remained high
↓
◾️Number of operative personnel increased
◾️Unit price of engineers rose
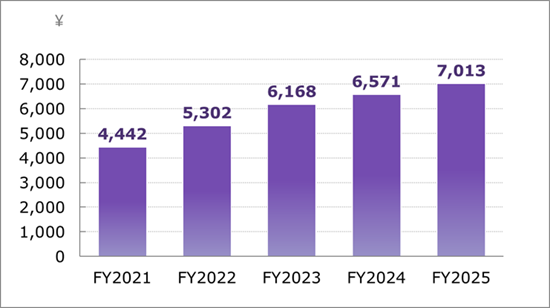
Cost of sales increased as the number of engineers increased.
◾️Whereas net sales increased by 10.0%, the cost of sales increased by no more than 6.7%. As a result, gross profit increased by a higher percentage than net sales.
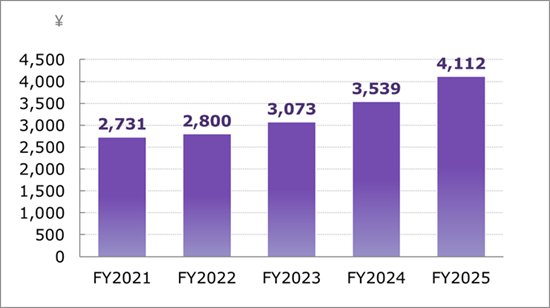
◾️Expenses were incurred from expanding the learning centers in East Japan (training facilities).
◾️TRecruitment-related investment expenses increased.
◾️Whereas gross profit increased by 16.2%, SG&A expenses increased by no more than 14.2%. As a result, operating profit increased by a higher percentage than gross profit.
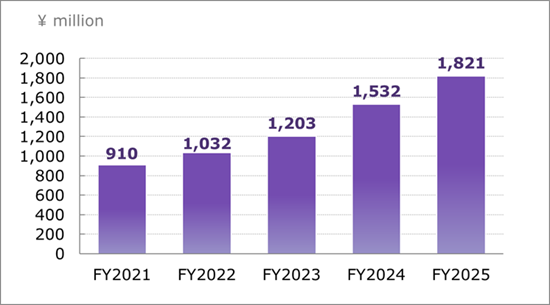
◾️Non-operating income and non-operating expenses were about the same as those in the previous year. As a result, ordinary profit increased by around the same percentage as operating profit.
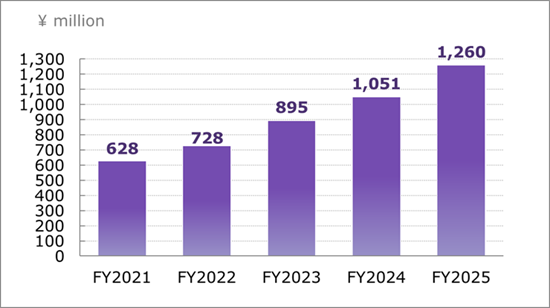
◾️Record-high profit.
◾️As profit before tax and expenses remained steady, profit increased by a higher percentage than net sales.
*Fiscal year ended January 31
Unit: ¥ million
Data on major indicators is provided below as an Excel file for use in spreadsheet software.
Quarterly Financial Fact Book for Q4 (FY2026) [Excel 23.9KB]
Financial Fact Book for full year (FY2026) [Excel 28.6KB]
 Cookie Settings