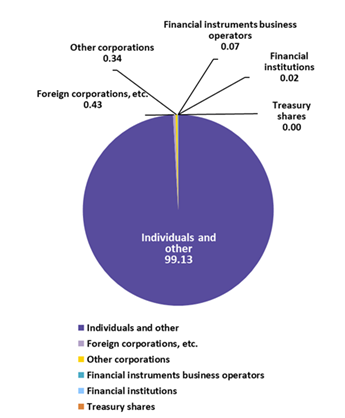
As of January 31, 2026
| Owner | Number of shareholders | Ratio (%) |
|---|---|---|
| Individuals and other | 25,203 | 99.13 |
| Foreign corporations, etc. | 110 | 0.43 |
| Other corporations | 86 | 0.34 |
| Financial instruments business operators | 19 | 0.07 |
| Financial institutions | 5 | 0.02 |
| Treasury shares | 1 | 0.00 |
| Total | 25,424 | 100.00 |
* The data above includes shares of less than one unit.
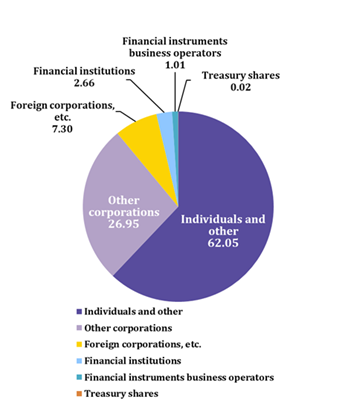
As of January 31, 2026
| Owner | Number of shares | Ratio (%) |
|---|---|---|
| Individuals and other | 6,594,799 | 62.05 |
| Other corporations | 2,864,480 | 26.95 |
| Foreign corporations, etc. | 776,218 | 7.30 |
| Financial institutions | 282,600 | 2.66 |
| Financial instruments business operators | 107,266 | 1.01 |
| Treasury shares | 2,557 | 0.02 |
| Total | 10,627,920 | 100.00 |
* The data above includes shares of less than one unit.
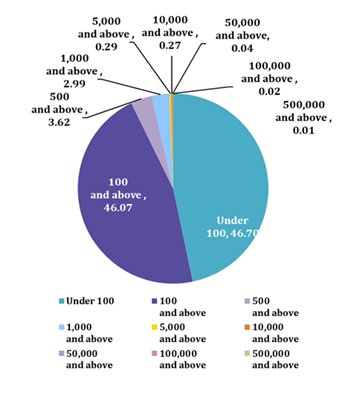
As of January 31, 2026
| Number of shares held | Number of shareholders | Ratio (%) |
|---|---|---|
| Under 100 | 11,872 | 46.70 |
| 100 and above | 11,712 | 46.07 |
| 500 and above | 920 | 3.62 |
| 1,000 and above | 760 | 2.99 |
| 5,000 and above | 74 | 0.30 |
| 10,000 and above | 68 | 0.27 |
| 50,000 and above | 10 | 0.04 |
| 100,000 and above | 6 | 0.02 |
| 500,000 and above | 2 | 0.01 |
| Total | 25,424 | 100.00 |
* The data above includes shares of less than one unit.
 Cookie Settings