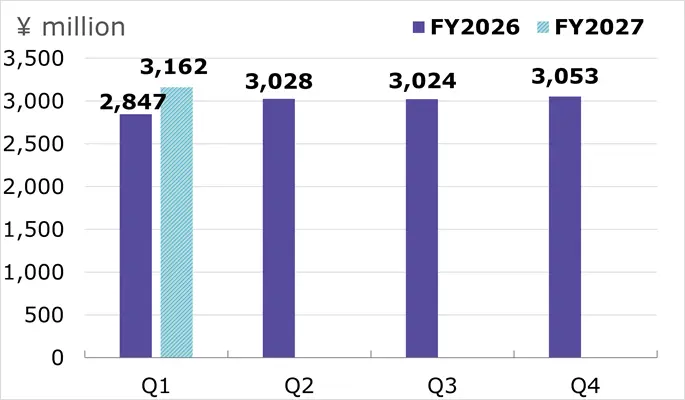
up 11.0%
◾️Number of engineers increased
◾️Utilization rate remained high
↓
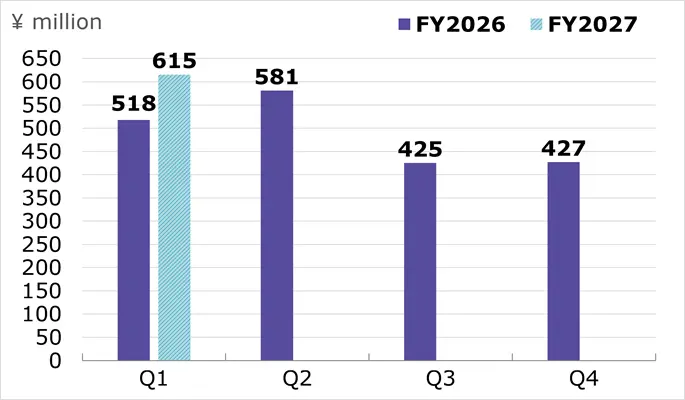
◾️Number of operative personnel increased
◾️Unit price of engineers rose
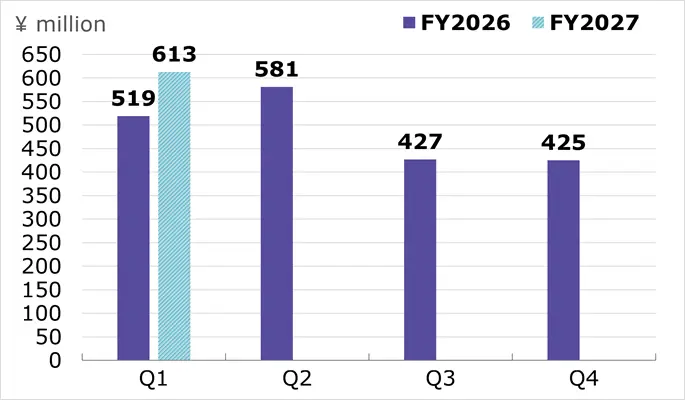
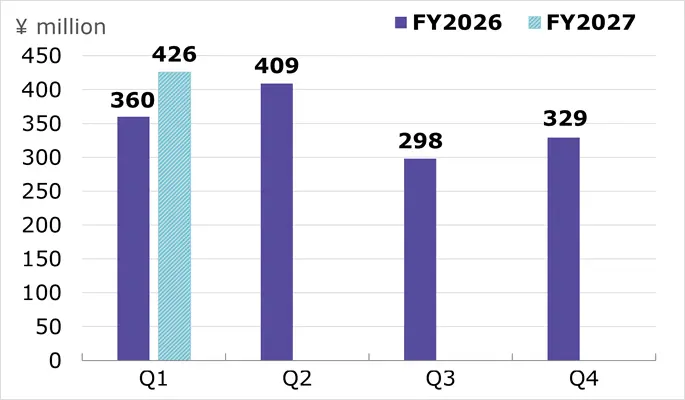
◾️As the percentage increase in SG&A expenses exceeded that of gross profit at 18.7% versus 11.3%, the percentage increase in operating profit fell below that of gross profit.
up 18.1%
up 18.3%
Data on major indicators is provided below as an Excel file for use in spreadsheet software.
Quarterly Financial Fact Book for Q4 (FY2026) [Excel 23.9KB]
Financial Fact Book for full year (FY2026) [Excel 28.6KB]
 Cookie Settings