Segment Data

Trends in Net Sales by Segment

Net Sales by Business
Ratio (%)
Trends Over Past Five Years

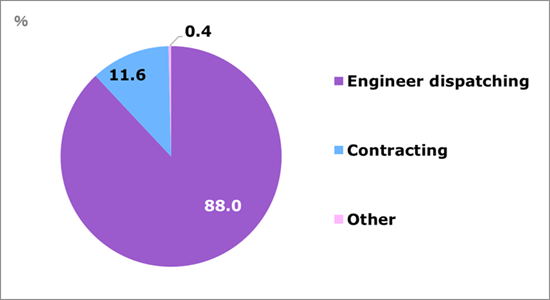
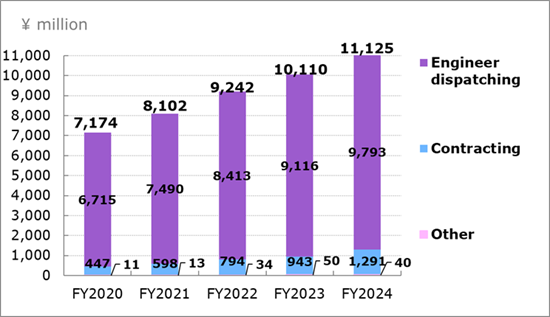
◾️In the contracting business, aggressive sales activities have led to an increasing number of engineers assigned to contracted projects.

Net Sales by Industry Field
Ratio (%)
Trends Over Past Five Years
 

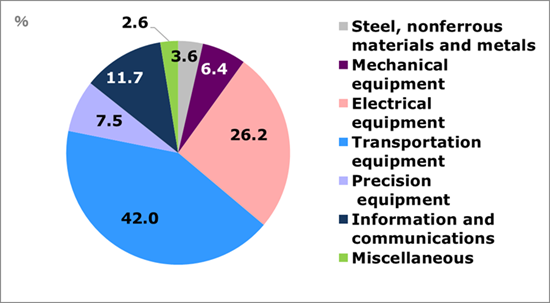
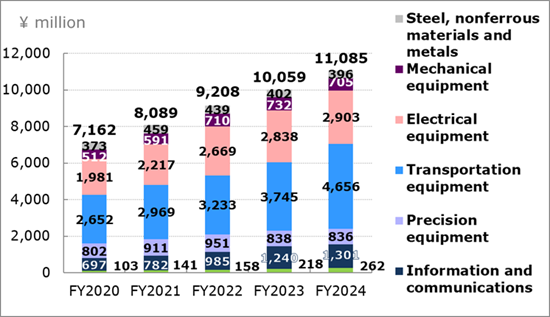
◾️Interest in development remains strong in various industry fields, such as transportation equipment and electrical equipment, which include our main clients, manufacturers in industries related to automobiles and semiconductor manufacturing equipment, respectively.

Net Sales by Technology Field
Ratio (%)
Trends Over Past Five Years

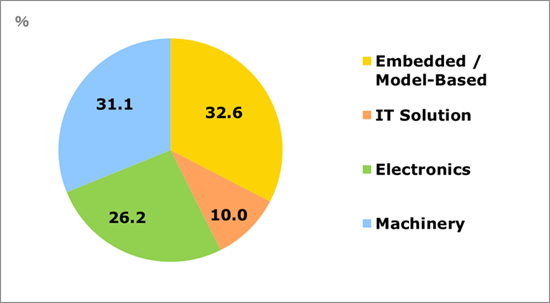
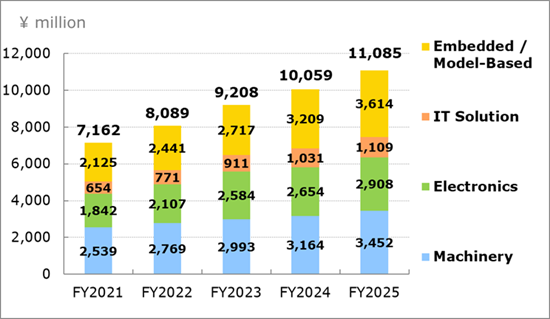
◾️The automobile industry is in the middle of technological innovation (e.g., CASE technologies). With the advances in software for these purposes, demand for software engineers has increased.

Net Sales by Region
Ratio (%)
Trends Over Past Five Years
 

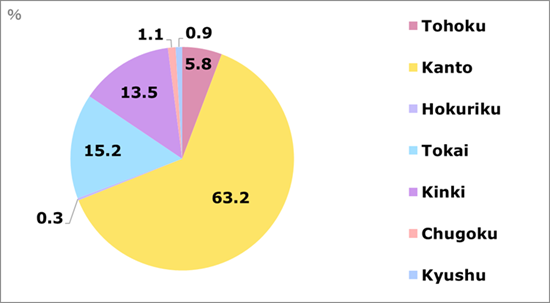
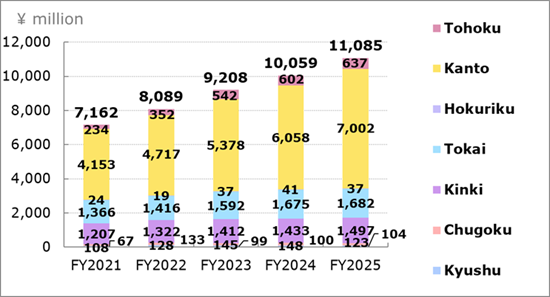
◾️The net sales ratio has increased in the Kanto region where our main clients, automobile manufacturers, auto parts manufacturers, and semiconductor manufacturing equipment manufacturers, are concentrated.

*Fiscal year ended January 31
Unit: ¥ million

Please scroll sideways.
(Non-consolidated)
FY2022
(Reporting Period60)
(Non-consolidated)
FY2023
(Reporting Period61)
(Non-consolidated)
FY2024
(Reporting Period62)
(Non-consolidated)
FY2025
(Reporting Period63)
(Consolidated)
FY2026
(Reporting Period64)
Net sales by business 8,102 9,242 10,110 11,125 11,954
Engineer dispatching 7,490 8,413 9,116 9,793 10,343
Contracting 598 794 943 1,291 1,557
Other 13 34 50 40 53
Net sales by Industry Field 8,089 9,208 10,059 11,085 11,901
Steel, nonferrous materials and metals 459 439 402 396 408
Mechanical equipment 591 710 732 705 681
Electronic devices 2,217 2,669 2,838 2,903 2,958
Transportation equipment 2,969 3,233 3,745 4,656 5,274
Precision equipment 911 951 838 836 988
Information and communications 782 985 1,240 1,301 1,274
Miscellaneous 158 218 262 285 316
Net sales by technology field 8,089 9,208 10,059 11,085 11,901
Embedded / Model-Based 2,441 2,717 3,209 3,614 4,087
IT Solution 771 911 1,031 1,109 1,261
Electronics 2,107 2,584 2,654 2,908 2,995
Machinery 2,769 2,993 3,164 3,452 3,557
Net sales by region 8,089 9,208 10,059 11,085 11,901
Tohoku 352 542 602 637 608
Kanto 4,717 5,378 6,058 7,002 7,748
Hokuriku 19 37 41 37 35
Tokai 1,416 1,592 1,675 1,682 1,786
Kinki 1,322 1,412 1,433 1,497 1,549
Chugoku 128 145 148 123 92
Kyushu 133 99 100 104 81
* Net sales for the “Other” business reflect revenues from human resources education, training and guidance operations, personnel placement commissions, etc.
* Net sales by industry field, technology field and region do not include sales at the “Other” business.
Related Links
FY2025 Financial Summary Supplementary Explanation Material [PDF 5.04MB/23 pages]

Trends in Engineers

Ratio (%)
Trends Over Past Five Years

*Fiscal year ended January 31

Please scroll sideways.
(Non-consolidated)
FY2022
(Reporting Period60)
(Non-consolidated)
FY2023
(Reporting Period61)
(Non-consolidated)
FY2024
(Reporting Period62)
(Non-consolidated)
FY2025
(Reporting Period63)
(Consolidated)
FY2026
(Reporting Period64)
Embedded / Model-Based 318 340 373 409 440
IT Solution 140 149 150 160 195
Electronics 274 318 313 319 314
Machinery 341 350 356 363 366
Total 1,073 1,157 1,192 1,251 1,315
Related Links
FY2025 Financial Summary Supplementary Explanation Material [PDF 5.04MB/23 pages]

Major Indicators

Data on major indicators is provided below as an Excel file for use in spreadsheet software.
Quarterly Financial Fact Book for Q4 (FY2026) [Excel 23.9KB]
Financial Fact Book for full year (FY2026) [Excel 28.6KB]

TOP