Here, we highlight the indicators that we focus on in order to achieve our performance targets.
Conceptualization of Net Sales, Expenses, and Improving Margin Percentages
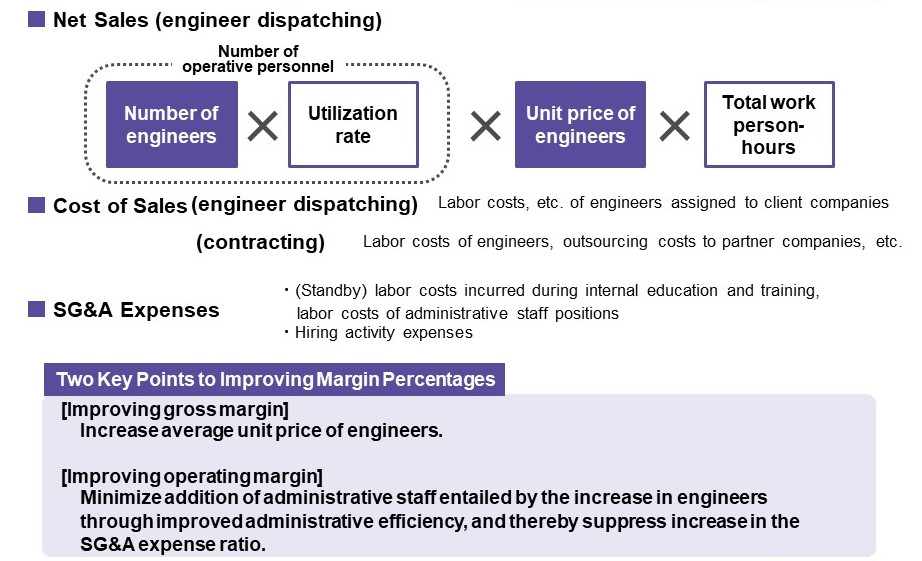
Fiscal Year Ended January 31, 2026: Sales-related Components
| Term-end engineer count |
1,315 |
| Utilization rate (%) (average) |
98.1 |
| Unit price of engineers, per engineer (yen/hour) (average) |
4,713 |
| Total work person-hours, per engineer (hours/month) (average) |
164 |
Utilization Rates and Month-End Engineer Count
Utilization Rates and Month-End Engineer Count
Related Links
Summary of Consolidated Financial Results for the Fiscal Year Ended January 31, 2026 (Under Japanese GAAP) [PDF 758KB/13 pages]
FY2026 Financial Summary Supplementary Explanation Material [PDF 1.37MB/26 pages]
 Cookie Settings