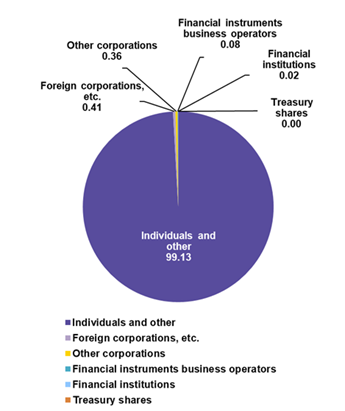
As of July 31, 2025
| Owner | Number of shareholders | Ratio (%) |
|---|---|---|
| Individuals and other | 23,989 | 99.13 |
| Foreign corporations, etc. | 100 | 0.41 |
| Other corporations | 86 | 0.36 |
| Financial instruments business operators | 19 | 0.08 |
| Financial institutions | 5 | 0.02 |
| Treasury shares | 1 | 0.00 |
| Total | 24,200 | 100.00 |
* The data above includes shares of less than one unit.

As of July 31, 2025
| Owner | Number of shares | Ratio (%) |
|---|---|---|
| Individuals and other | 6,732,807 | 63.35 |
| Other corporations | 2,696,496 | 25.37 |
| Foreign corporations, etc. | 834,952 | 7.86 |
| Financial institutions | 240,200 | 2.26 |
| Financial instruments business operators | 120,908 | 1.14 |
| Treasury shares | 2,557 | 0.02 |
| Total | 10,627,920 | 100.00 |
* The data above includes shares of less than one unit.
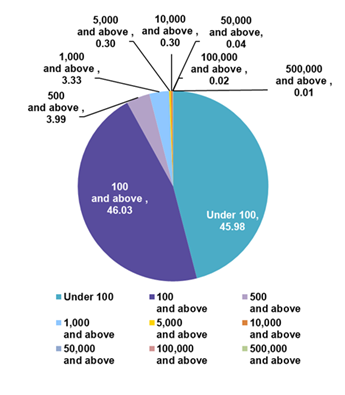
As of July 31, 2025
| Number of shares held | Number of shareholders | Ratio (%) |
|---|---|---|
| Under 100 | 11,126 | 45.98 |
| 100 and above | 11,139 | 46.03 |
| 500 and above | 966 | 3.99 |
| 1,000 and above | 806 | 3.33 |
| 5,000 and above | 73 | 0.30 |
| 10,000 and above | 73 | 0.30 |
| 50,000 and above | 9 | 0.04 |
| 100,000 and above | 6 | 0.02 |
| 500,000 and above | 2 | 0.01 |
| Total | 24,200 | 100.00 |
* The data above includes shares of less than one unit.
 Cookie Settings